

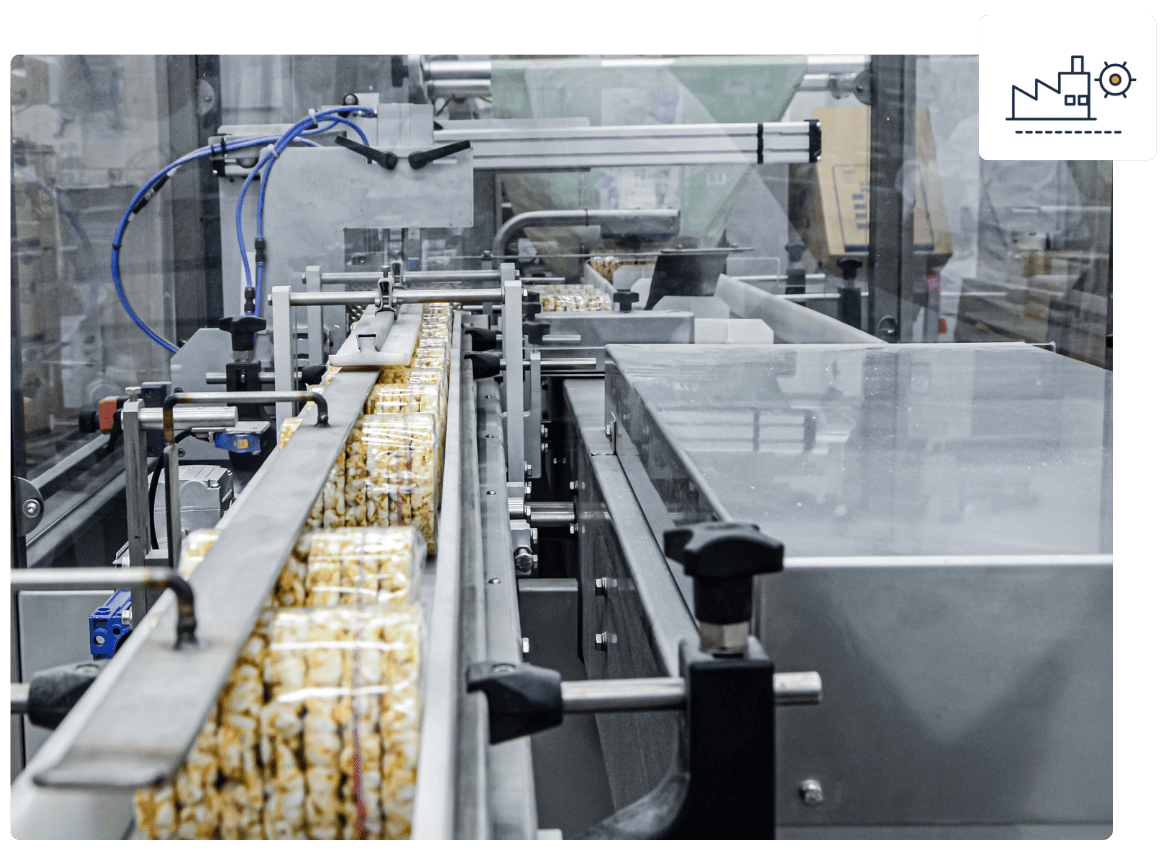
• Industry: Manufacturing & Food Productions
Data solutions for maximum utility efficiency from the production line to the cold room to the store front.
Pristine data, service monitoring, and no late fees are only the beginning of our custom-built solutions that empower decision makers by bridging the gap between finance and operations with actionable insights you can trust.
HOW M.U.C. PARTNERS WITH MANUFACTURING & FOOD PRODUCTION FACILITIES
Your operation measures in units you understand. Your utilities and reoccurring charges should too.
When utility data from multiple vendors across multiple sites are merely processed, no one can fully trust or make meaningful decisions from the data.
The questions that matter — What does energy add to my cost per unit? Which machine, which line, which facility is the outlier? — stay out of reach. M.U.C. is built for the way manufacturing actually runs so questions are answered, expenses and savings are visible, and data informs decisions.

Zero late fees. Guaranteed.
Our bill-pay clients will never pay late fee. If a late fee ever hits, we pay it — not you.

Cost and efficiency, down to the machine.
Submetered and monitored for efficiency, production-tied data. Know what energy adds to every unit & where you can save.
Production Accruals
Utility spend accrued against units produced and shifts run — so energy lands in your cost per unit, not in overhead.
Anomalies caught before they compound
A drifting compressor, a leaking line, a rate class change — we spot them early, before it becomes a five-figure surprise.

New site consulting
Energy generation and efficiency consulting while the site's still on paper — decisions that pay back for the life of the facility.
Compliance reporting at a fraction of the cost
The data behind ENERGY STAR for plants, EPDs, and environmental reporting — already gathered, so compliance costs a fraction of doing it alone.
M.U.C. SOLUTIONS FOR MANUFACTURING & FOOD PRODUCTION FACILITIES
One team, every possible solution.
Every M.U.C. solution is customized for your facilities and financial structure. Our systems work with systems you already use. Utility data arrives GL-coded to match your chart of accounts and allocated to suit your departmental matrix — no new software, no training, no added workload. And if your campus has a problem we haven't solved yet, we'll build the solution.
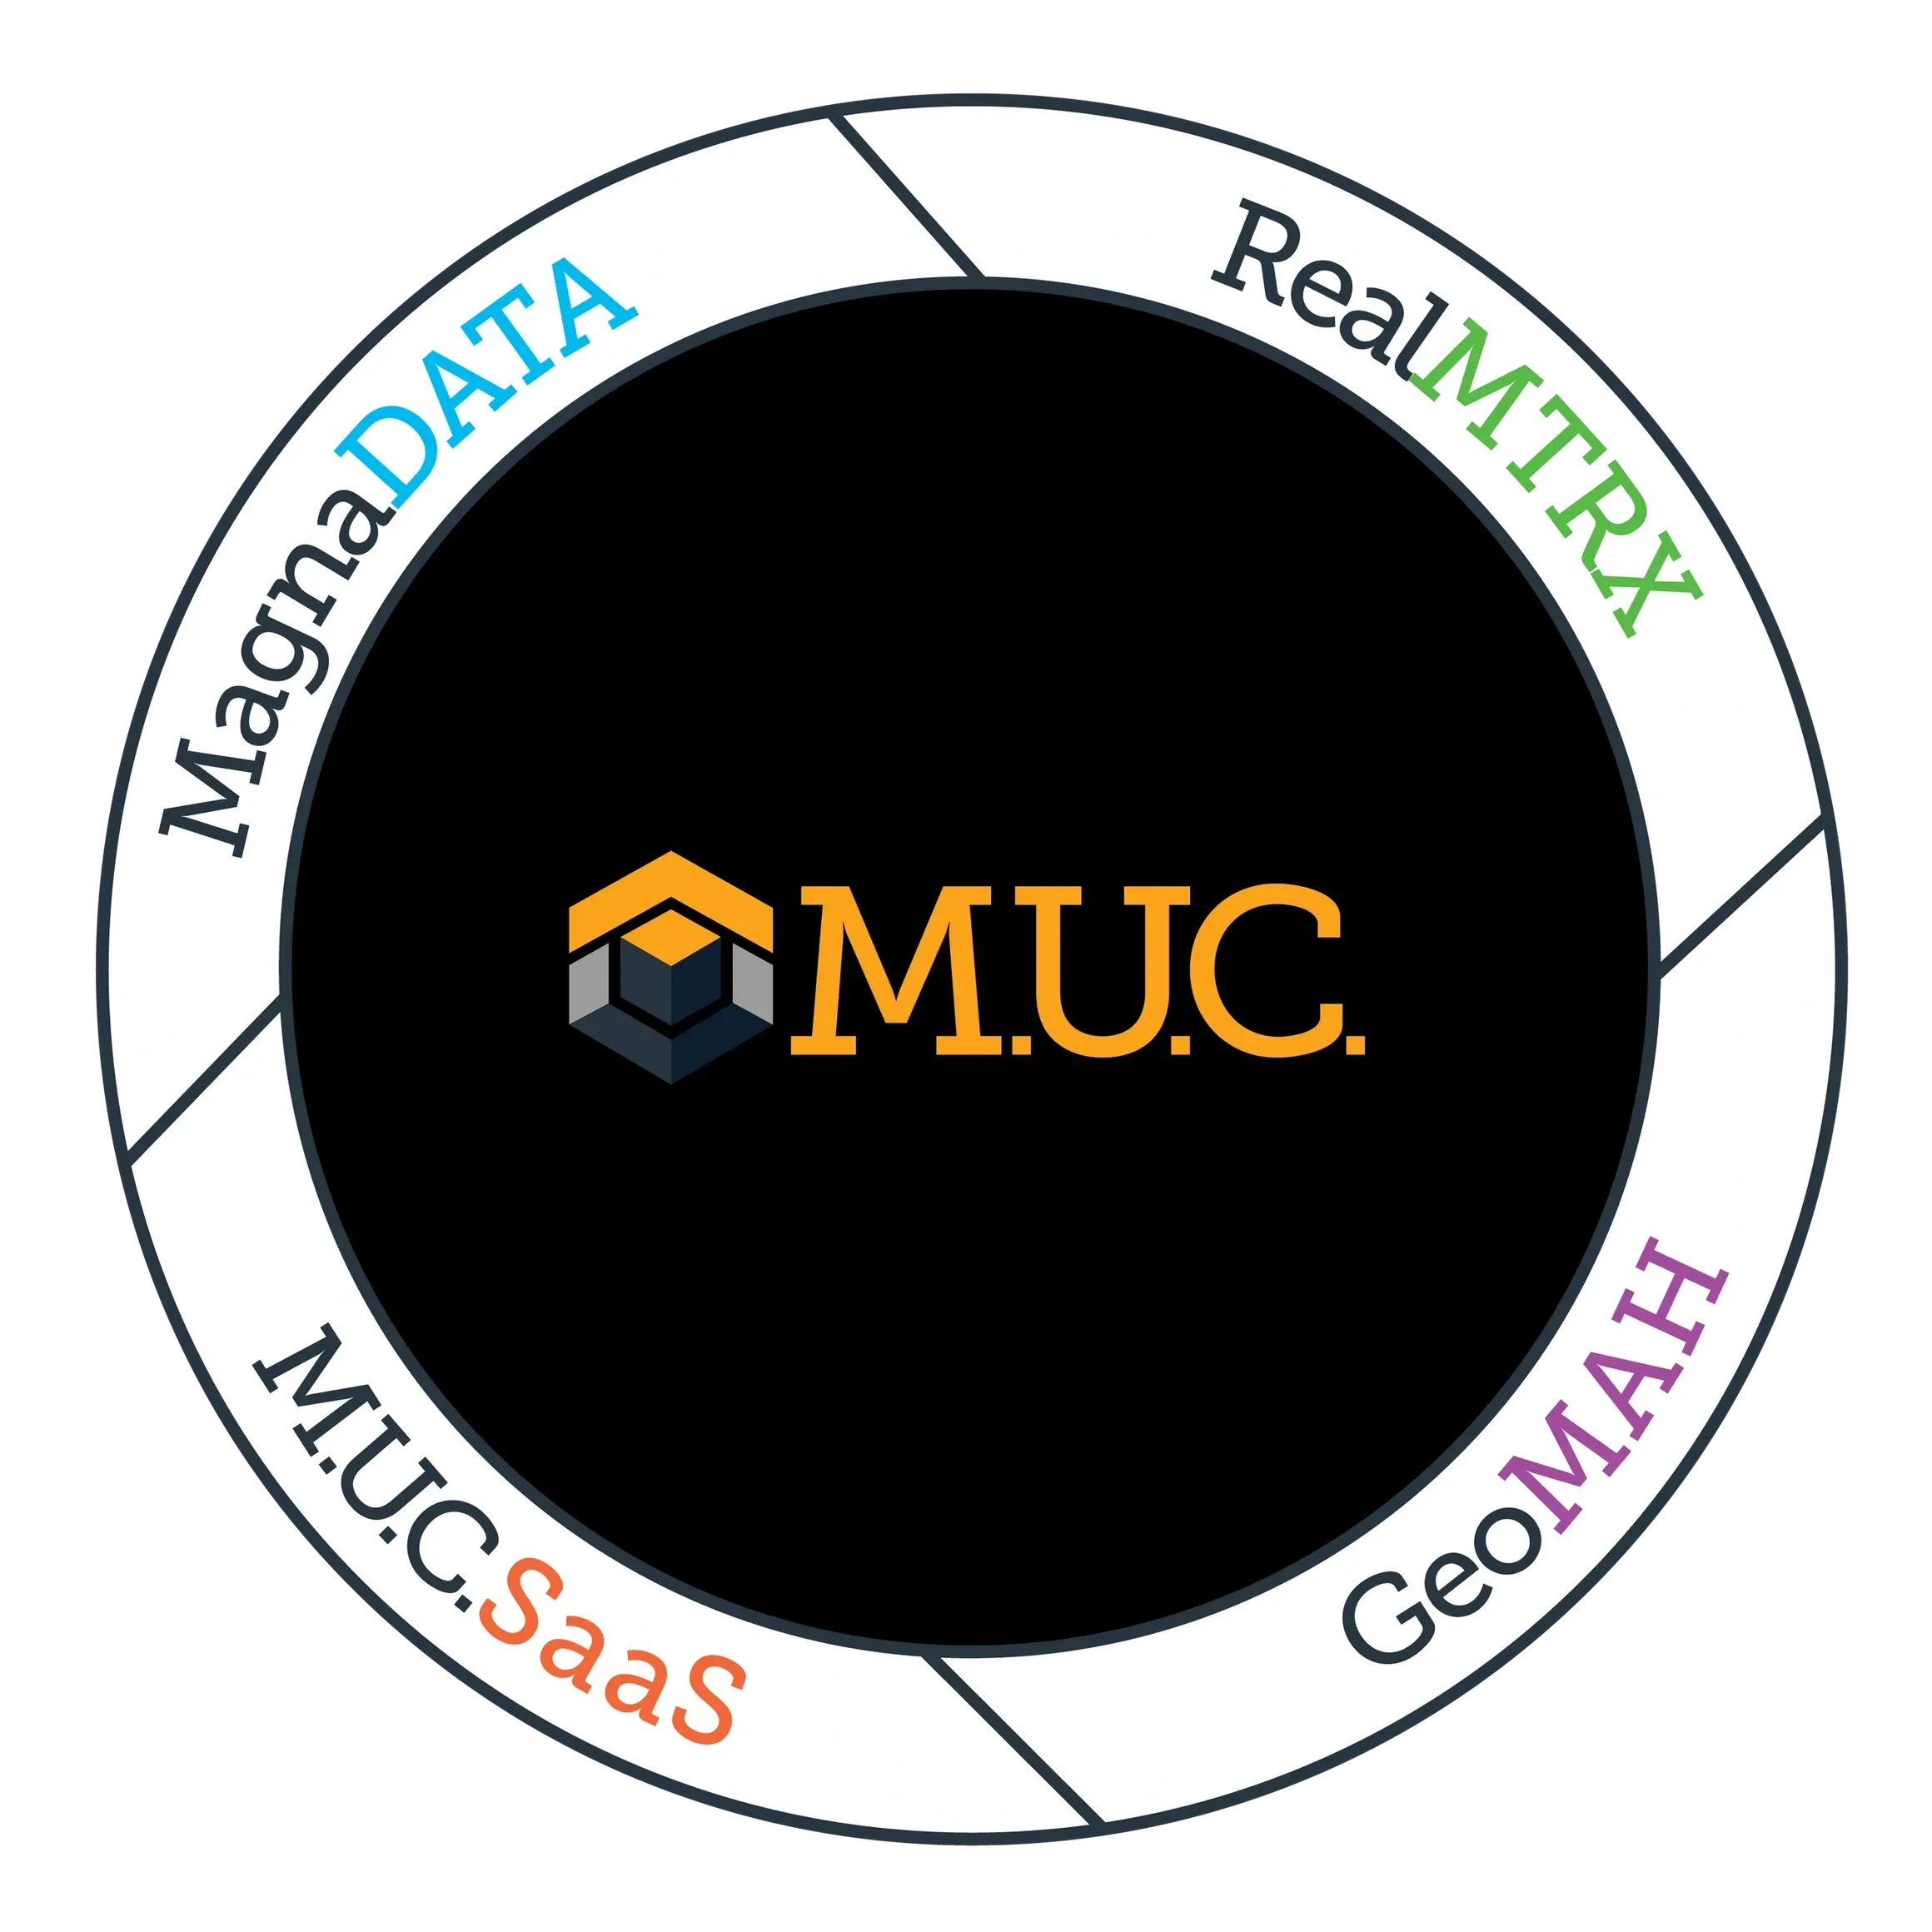
GeoMAH – Data Analytics & Visualization
Turn raw utility and operational data into clear, actionable reporting.
M.U.C. SaaS– Invoice & Data Management
Handle utility management, from invoice to payment.
MagnaDATA – Custom Tools & AI Solutions
AI is an instrument. MagnaDATA conducts it. Custom-built tools, trackers, and reporting designed around your operation.
Environmental Compliance & ESG Reporting
Track, report, and act on the environmental data.
RealMTRX
A solution for investors, property owners, and managers for tenant utility billing, from invoicing to sub-metering to sustainability reporting.

FROM THE FIELD
“Quote Needed”
FREQUENTLY ASKED QUESTIONS
Questions we hear on the first call.
-
Every account, meter, and site rolls into one system, coded to your chart of accounts. Each facility's spend lands in the right GL line automatically.
-
Yes — from single-facility operations to multi-state producers. You only use the solutions that fit, nothing you don't need.
-
M.U.C. maps to your systems and people rather than replacing them. Data arrives formatted to match your accounting software — nothing re-keyed, no new platform to learn.
-
No. M.U.C. handles submeter installation and monitoring on your machinery and equipment as part of the engagement — from identifying the heaviest draws to getting clean, machine-level data flowing.
-
Yes — new site consulting covers onsite energy generation, efficiency, and utility solutions during planning, so the energy side is designed in rather than retrofitted.
-
It starts with a conversation, not a demo. We look at how your facilities and accounts are set up, find the quick wins, and map out onboarding — which, for most clients, is far less work than they expect.
LET’S TALK ABOUT YOUR OPERATION
Whether you're managing one facility or one hundred, M.U.C. can transform your utility data into knowledge that saves money now — and informs the decisions ahead.
• 25 years, zero clients lost • SOC 2 Certified • U.S. - based team